Author

When Aerodynamics Cause a Design to Take Off
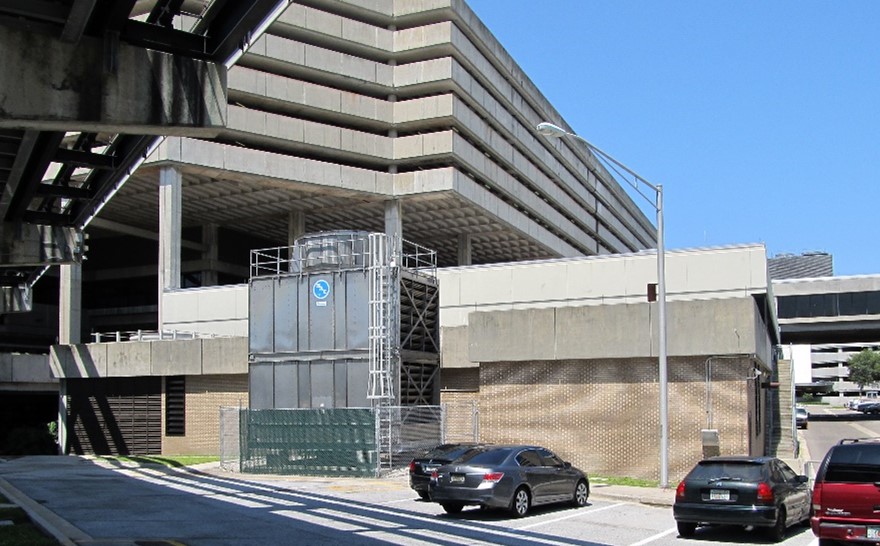
When did the discussion of the TPA Central Utility Plant (CUP) all start? In 2012, my first project at TLC was to design the new 3300-ton cooling towers at the existing CEP. Prevailing summer winds from the northwest had been a problem at the original 1968 building. The interior cooling towers with louvered intake and exhaust on the east wall were changed to exterior architecture with ceramic fill in 1983; the towers now relied on vertical heat rejection. Because the cooling tower fans were trying to reject hot air lower than the building roof to the west, it caused the recirculation of hot air back into the cooling tower intakes. In this way, the building acts like an airfoil by redirecting the airflow based on pressure differences created due to its geometry. The reduction in dissipated airflow upward significantly reduces the cooling tower capacity and, therefore, must be considered in the design of the new CUP.
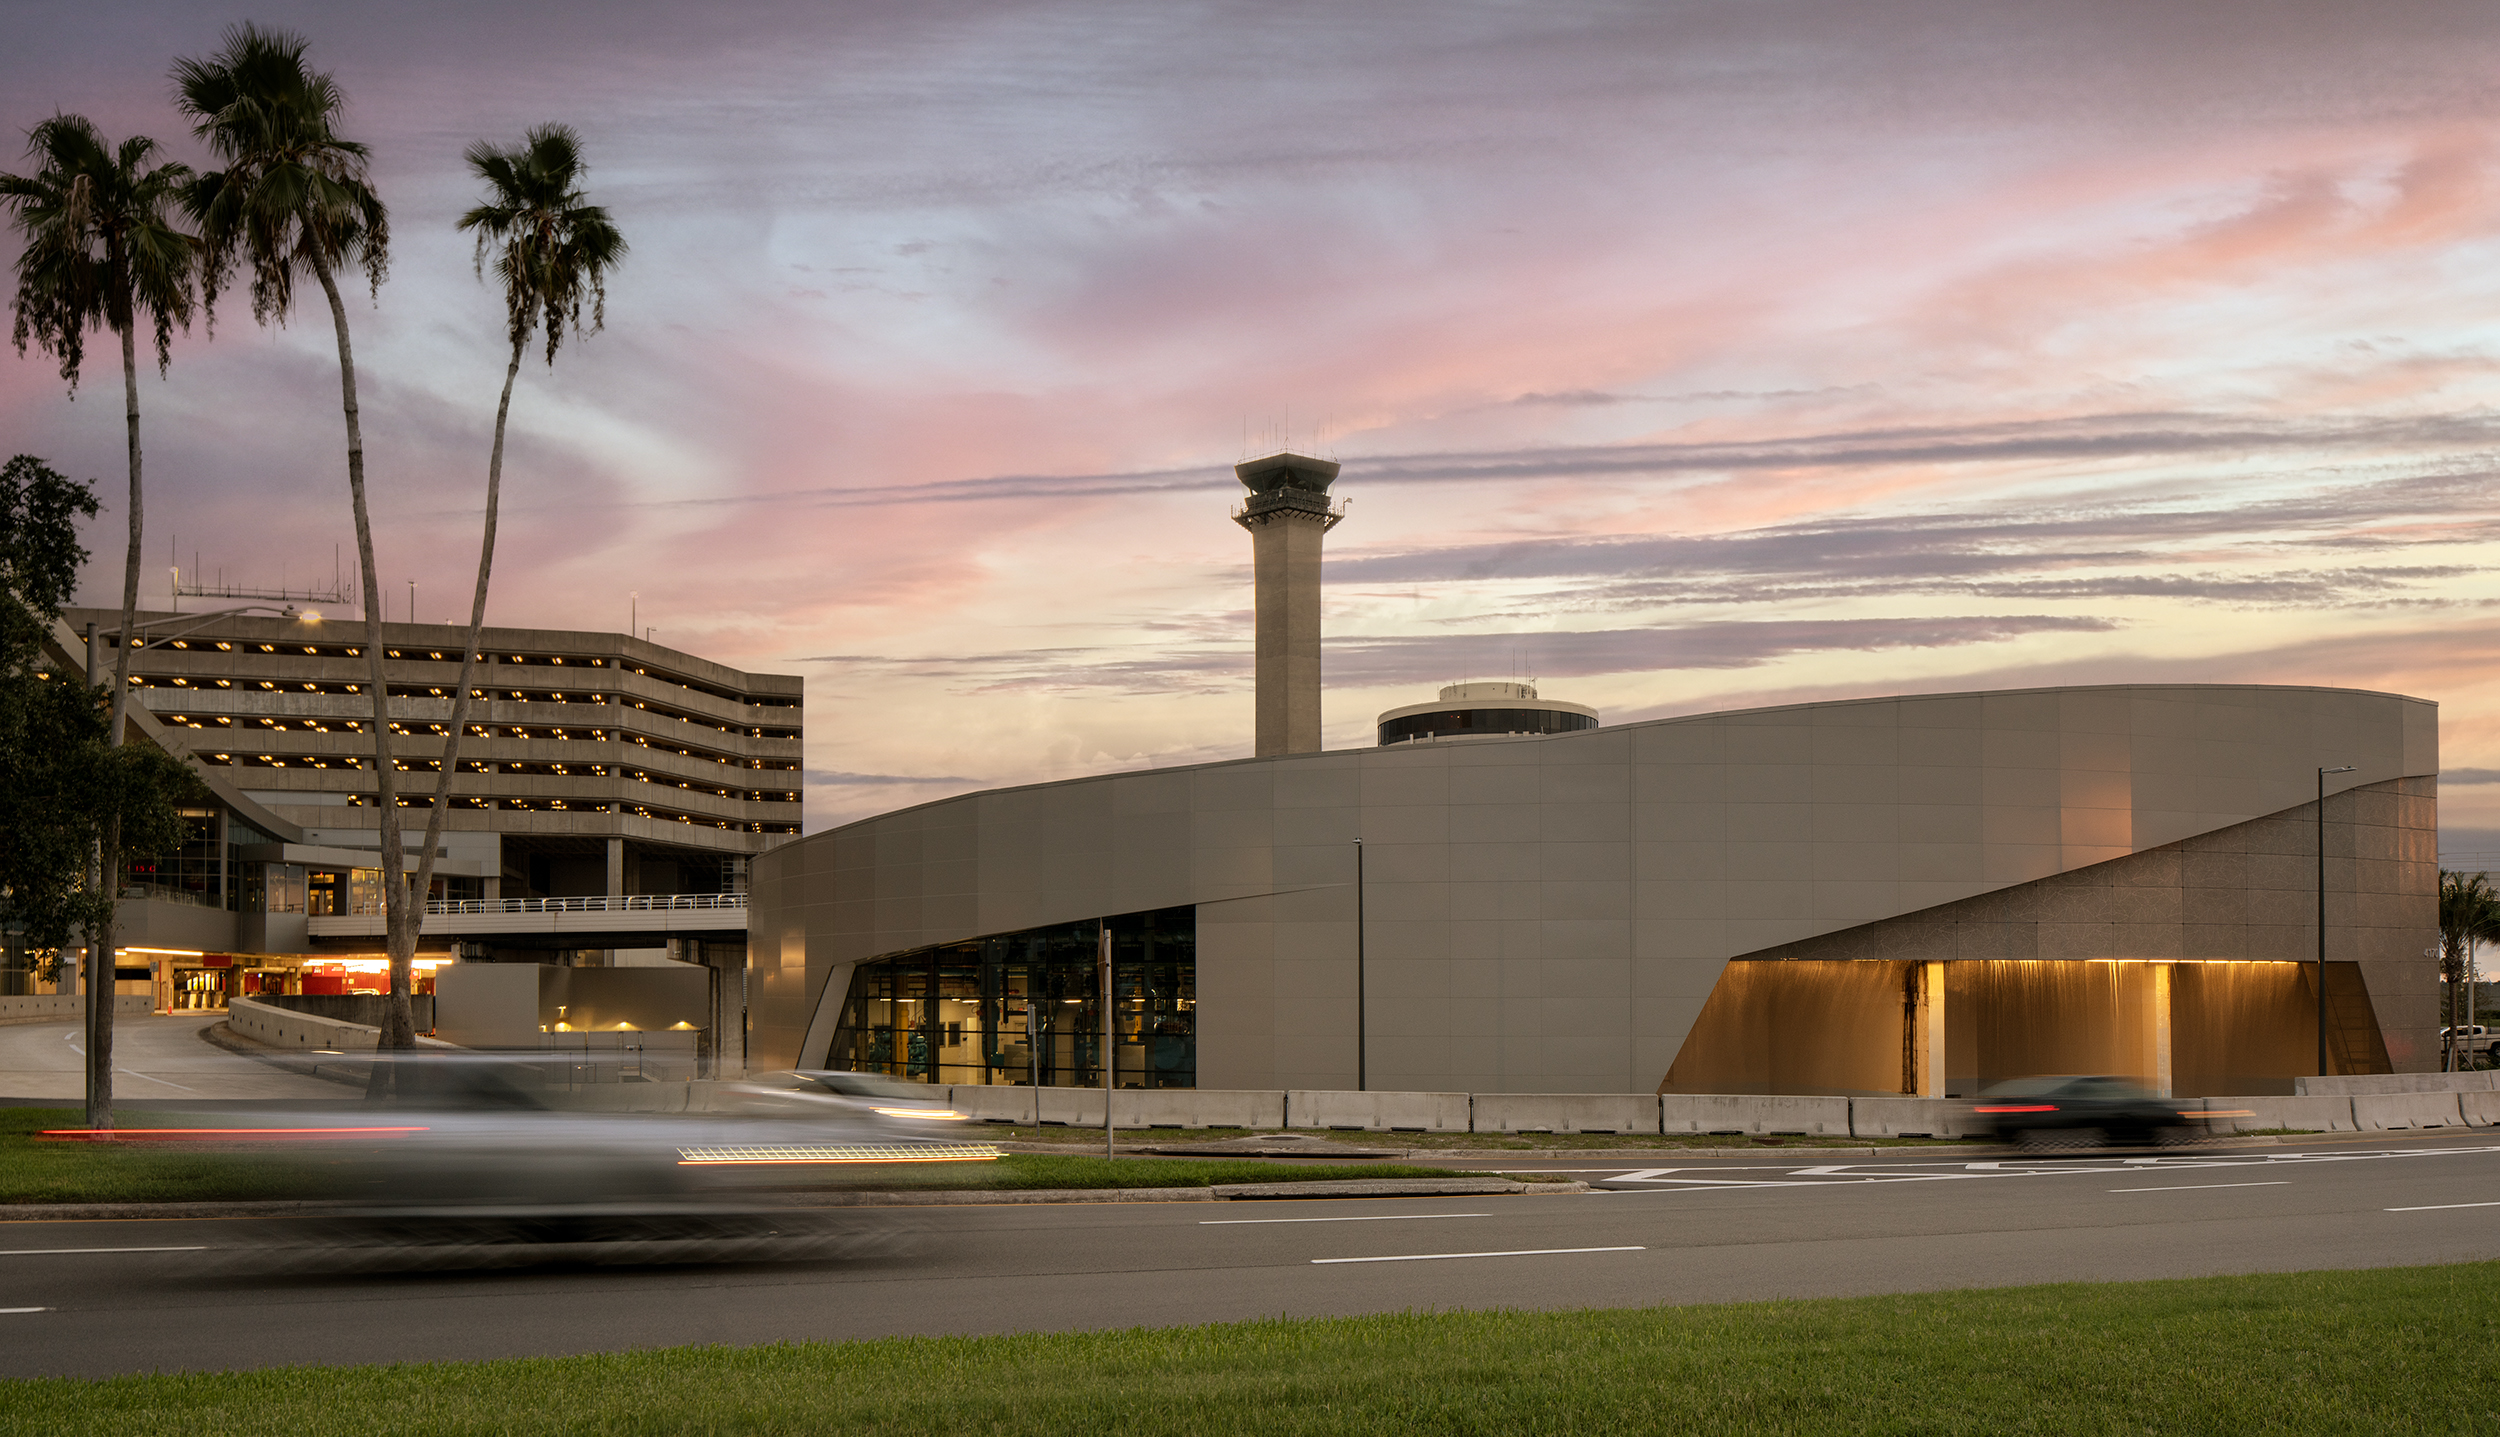
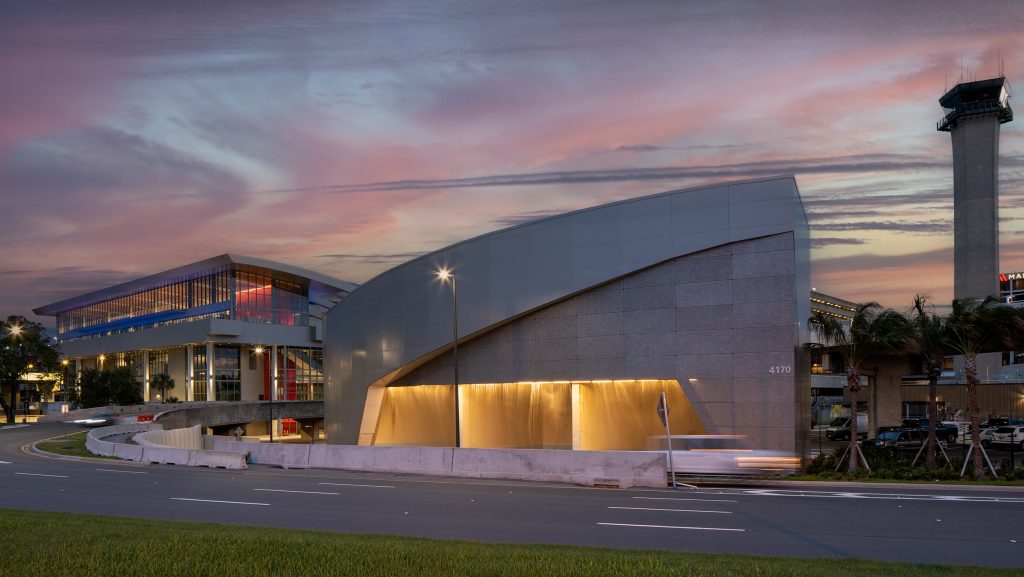
The new larger CUP site demanded a multi-variable design approach to maximize the site area for 6000 tons of cooling / 10,000 MBH of heating / 4000A electrical capacity, which were conducive to Architectural Cooling Towers, allowing ultimate flexibility in size and orientation, not to mention life span and structural superiority for hurricane winds. In this case, we wanted a ‘free fall’ cooling tower, open on (1) one side towards the roadway, which created the next challenge, how to configure these on the site and still have the intake unobstructed.
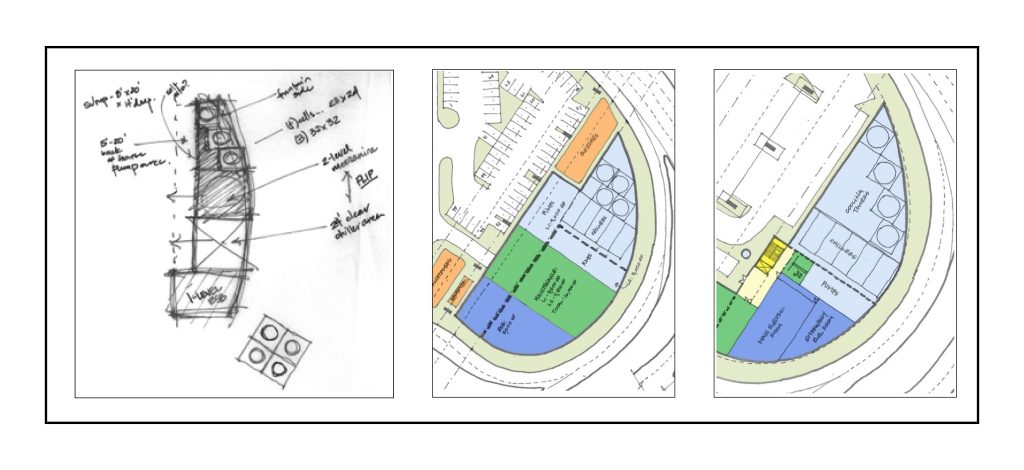
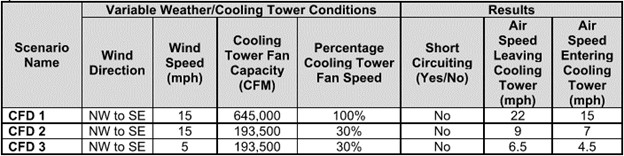
With the aid of Computational Fluid Dynamics modeling software ran in Autodesk Fusion, we compared three scenarios to verify no short-circuiting of airflow. The key is to look at multiple operating conditions, from full cooling (fans at 100%), max summer wind speed, and then at reduced fan airflow (30%), to be sure the exit velocities don’t get overcome by the prevailing wind.
While summer operation (CFD 1) is the most critical for cooling capacity, winter operation (CFD 2) is the most susceptible to recirculation because of the low exit velocities and high wind speeds. As you can imagine, winter cooling is not at full cooling tower capacity, so a thermal gain of recirculated air is of no consequence.
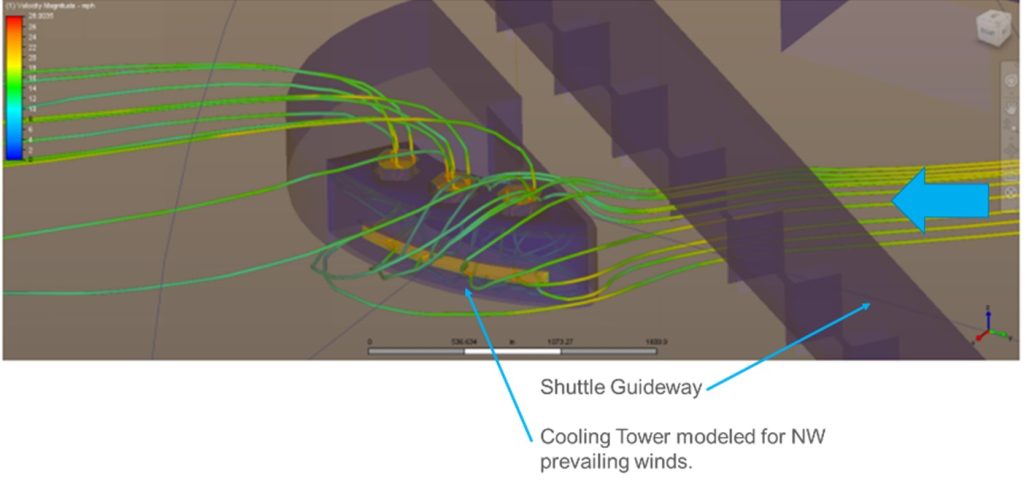
Understanding the graphics – the increase in wind speed around the building is shown going from green to yellow as it comes around the backside of the towers. You can see the effects of the sharp northerly point of the tower geometry and its role in the air wrapping around the front of the towers (intake) due to the increase in angular velocity and creating negative pressure.
Given a choice in the tower arrangement, I’d prefer to have the intake opening of the cooling tower away from the prevailing wind to minimize disruption of the freefall water and entrainment of debris into the basins. Secondly, using (3) larger towers instead of (4) allowed for more tonnage per square foot. As a final performance consideration, CTI testing was done to show capacity at peak wet bulb temperatures, in addition to the cycles of concentration as a tell-tail sign of efficiency of evaporation; however, it must be noted this is highly based on the incoming water quality and pre-treatment which can exasperate the material fallout caused by air movement into the cell. The moral of the story is don’t guess, do the analytics and successful modeling with accurate inputs results in predictable outcomes!